
NI Measurement Studio question
-
Colleagues, Does anyone know how to scroll the
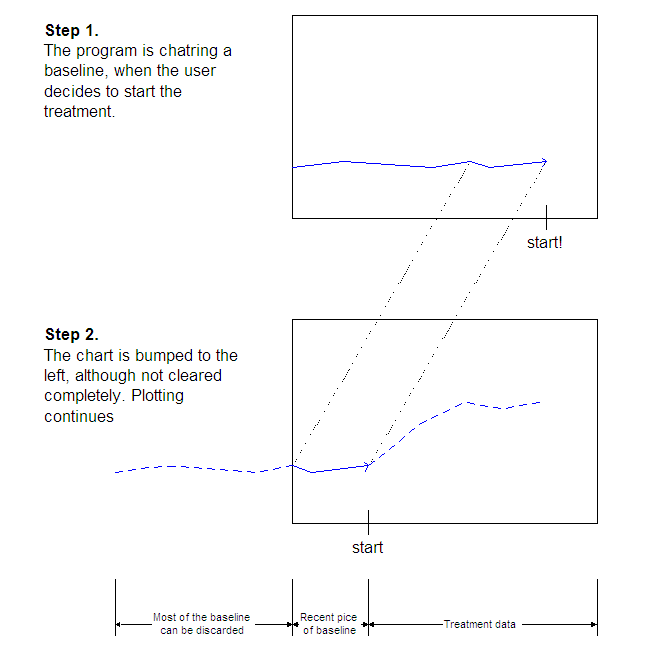
CWGraphcontrol? Here's the behavior I want to achieve: 1. The graph's X axis spans from 0 to 3000. In the beginning, it's charting a baseline (using ChartY method). 2. Let's say, it charted to 2500, when the user initiates a certain activity of interest. 3. Graph scrolls left leaving only the last 500 points of the baseline (this is the part I don't know how to do). The rest can be discarded. 4. Plotting continues from 500 onward. Here's the same behavior on a storyboard: http://www.prolifictec.com/filehost/CWGraph_shifting_rev01.PNG[^] Could anybody give me some suggestions? Thanks, - Nick P.S. I'm using VB6 and Measurement Studio 8.1.11. -
Colleagues, Does anyone know how to scroll the
CWGraphcontrol? Here's the behavior I want to achieve: 1. The graph's X axis spans from 0 to 3000. In the beginning, it's charting a baseline (using ChartY method). 2. Let's say, it charted to 2500, when the user initiates a certain activity of interest. 3. Graph scrolls left leaving only the last 500 points of the baseline (this is the part I don't know how to do). The rest can be discarded. 4. Plotting continues from 500 onward. Here's the same behavior on a storyboard: http://www.prolifictec.com/filehost/CWGraph_shifting_rev01.PNG[^] Could anybody give me some suggestions? Thanks, - Nick P.S. I'm using VB6 and Measurement Studio 8.1.11.Nick Alexeev wrote:
S. I'm using VB6 and Measurement Studio 8.1.11.
VB6 is long dead and completely unsupported. You should put VB6 in your subject line if you want help in obsolete technologies. Also, don't the people who wrote this grid have a forum ? I mean, EVERYONE there uses this grid, the odds are good, given it's a VB6 control, that close to no-one here uses it.
Christian Graus Driven to the arms of OSX by Vista.
-
Nick Alexeev wrote:
S. I'm using VB6 and Measurement Studio 8.1.11.
VB6 is long dead and completely unsupported. You should put VB6 in your subject line if you want help in obsolete technologies. Also, don't the people who wrote this grid have a forum ? I mean, EVERYONE there uses this grid, the odds are good, given it's a VB6 control, that close to no-one here uses it.
Christian Graus Driven to the arms of OSX by Vista.
Oh, I remember those guys at National Instruments. Not the best libraries in the world. I wasn't writing code against them, but I had to support systems using some of their work. Ugh. You single best source of information is going to be here[^]. It's extremely unlikely that you will find any help with those controls her, or on any other forum that doesn't belong to National Instruments.
A guide to posting questions on CodeProject[^]
Dave Kreskowiak Microsoft MVP Visual Developer - Visual Basic
2006, 2007, 2008 -
Oh, I remember those guys at National Instruments. Not the best libraries in the world. I wasn't writing code against them, but I had to support systems using some of their work. Ugh. You single best source of information is going to be here[^]. It's extremely unlikely that you will find any help with those controls her, or on any other forum that doesn't belong to National Instruments.
A guide to posting questions on CodeProject[^]
Dave Kreskowiak Microsoft MVP Visual Developer - Visual Basic
2006, 2007, 2008Dave Kreskowiak wrote:
[NI Measurement Studio is] Not the best libraries in the world.
IMHO, they are pretty good. May be they have improved since the last time you worked with them. I've just started using it. I've been looking for a chart control for plotting large amounts of data in real time (8 traces, 3000 points on the screen per trace, 10 new points a second on each trace). Among the chart controls that I've tried, CWGraph from MStudio had the best performance. - Nick
-
Dave Kreskowiak wrote:
[NI Measurement Studio is] Not the best libraries in the world.
IMHO, they are pretty good. May be they have improved since the last time you worked with them. I've just started using it. I've been looking for a chart control for plotting large amounts of data in real time (8 traces, 3000 points on the screen per trace, 10 new points a second on each trace). Among the chart controls that I've tried, CWGraph from MStudio had the best performance. - Nick
Nick Alexeev wrote:
May be they have improved since the last time you worked with them
Not likely. I was supporting the stuff for 4 years, as recent as last summer. Very little improvement and poor design decisions abounded from the start.
A guide to posting questions on CodeProject[^]
Dave Kreskowiak Microsoft MVP Visual Developer - Visual Basic
2006, 2007, 2008 -
Nick Alexeev wrote:
May be they have improved since the last time you worked with them
Not likely. I was supporting the stuff for 4 years, as recent as last summer. Very little improvement and poor design decisions abounded from the start.
A guide to posting questions on CodeProject[^]
Dave Kreskowiak Microsoft MVP Visual Developer - Visual Basic
2006, 2007, 2008Dave what are some of the poor design decisions in your opinion? May be you could give me a heads-up. I'd really appreciate that. - Nick